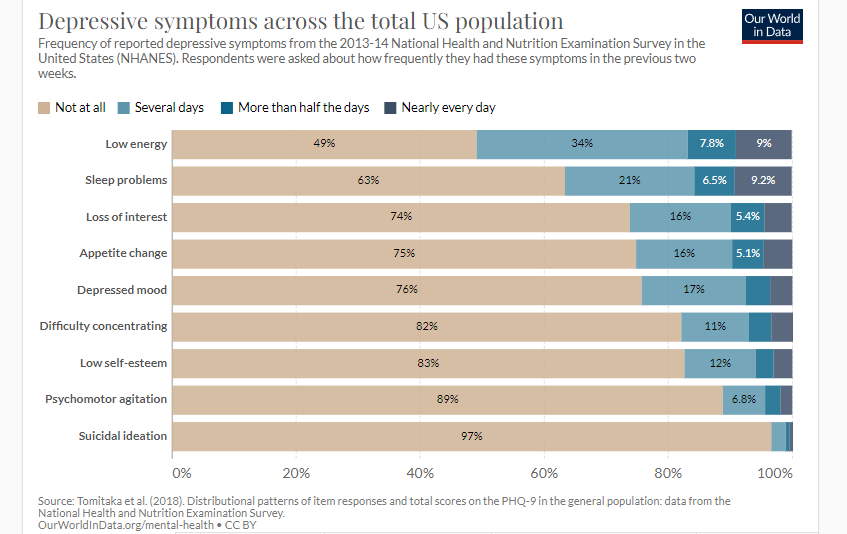
I downloaded “depressive symptoms across the total Us population” from Our world in data I selected this data because I’m interested in seeing how depression effects people differently mainly what symptoms people dont get in 2013-14 from the National Health and Nutrition Examination Survey.
This is the link to the data.
The following code chunk loads the package I will use to real in and prepare the data for analysis.
- Read the data in
- Use glimpse to see names and types of the column.
glimpse(frequency_depressive_symptoms_us)
Rows: 10
Columns: 7
$ Entity                    <chr> "Appetite change", "Average across~
$ Code                      <lgl> NA, NA, NA, NA, NA, NA, NA, NA, NA~
$ Year                      <dbl> 2014, 2014, 2014, 2014, 2014, 2014~
$ `None at all`             <dbl> 74.8, 76.3, 75.7, 82.1, 73.8, 49.1~
$ `Several days`            <dbl> 15.5, 15.0, 16.8, 10.9, 16.3, 34.0~
$ `More than half the days` <dbl> 5.1, 4.3, 3.9, 3.6, 5.4, 7.8, 2.9,~
$ `Nearly every day`        <dbl> 4.6, 4.4, 3.6, 3.5, 4.4, 9.0, 3.0,~
#view(frequency_depressive_symptoms_us)
- Use output from glimpse (and view) to prepare the data for analysis
Create the object
symptomsthat is the list of symptoms I want to extract from the data set..Change the name of the 1st column to symptoms and 4th coumn to NAA
Use filter to extract the rows that I want to keep: Year, NAA and symptoms in symptoms
select the column to keep: Entity, Year, none at all
assign the output to symptoms not shown
display the first 9 rows
symptoms  <- c("Appetite change",
               "Average acroos symptoms",
               "Depressed mood",
               "Difficulty concentrating",
               "Loss of interest",
               "Low energy",
               "Low self-esteem",
               "Psychomotor agitation",
               "Sleep problems",
               "Suicidal ideation")


Depression_symptoms_not_shown  <- frequency_depressive_symptoms_us %>%
  rename(Symptoms = 1, NAA = 4) %>%
  filter(Year == 2014, Symptoms %in% symptoms) %>%
  select(Symptoms, Year, NAA)

Depression_symptoms_not_shown
# A tibble: 9 x 3
  Symptoms                  Year   NAA
  <chr>                    <dbl> <dbl>
1 Appetite change           2014  74.8
2 Depressed mood            2014  75.7
3 Difficulty concentrating  2014  82.1
4 Loss of interest          2014  73.8
5 Low energy                2014  49.1
6 Low self-esteem           2014  82.6
7 Psychomotor agitation     2014  88.8
8 Sleep problems            2014  63.3
9 Suicidal ideation         2014  96.6
Check that the total for loss of interest equals the total in the graph
Add a picture
Write the data to file in the project directory
write_csv(Depression_symptoms_not_shown, file="Depression_symptoms_not_shown.csv")