My Blog
Project Part 2
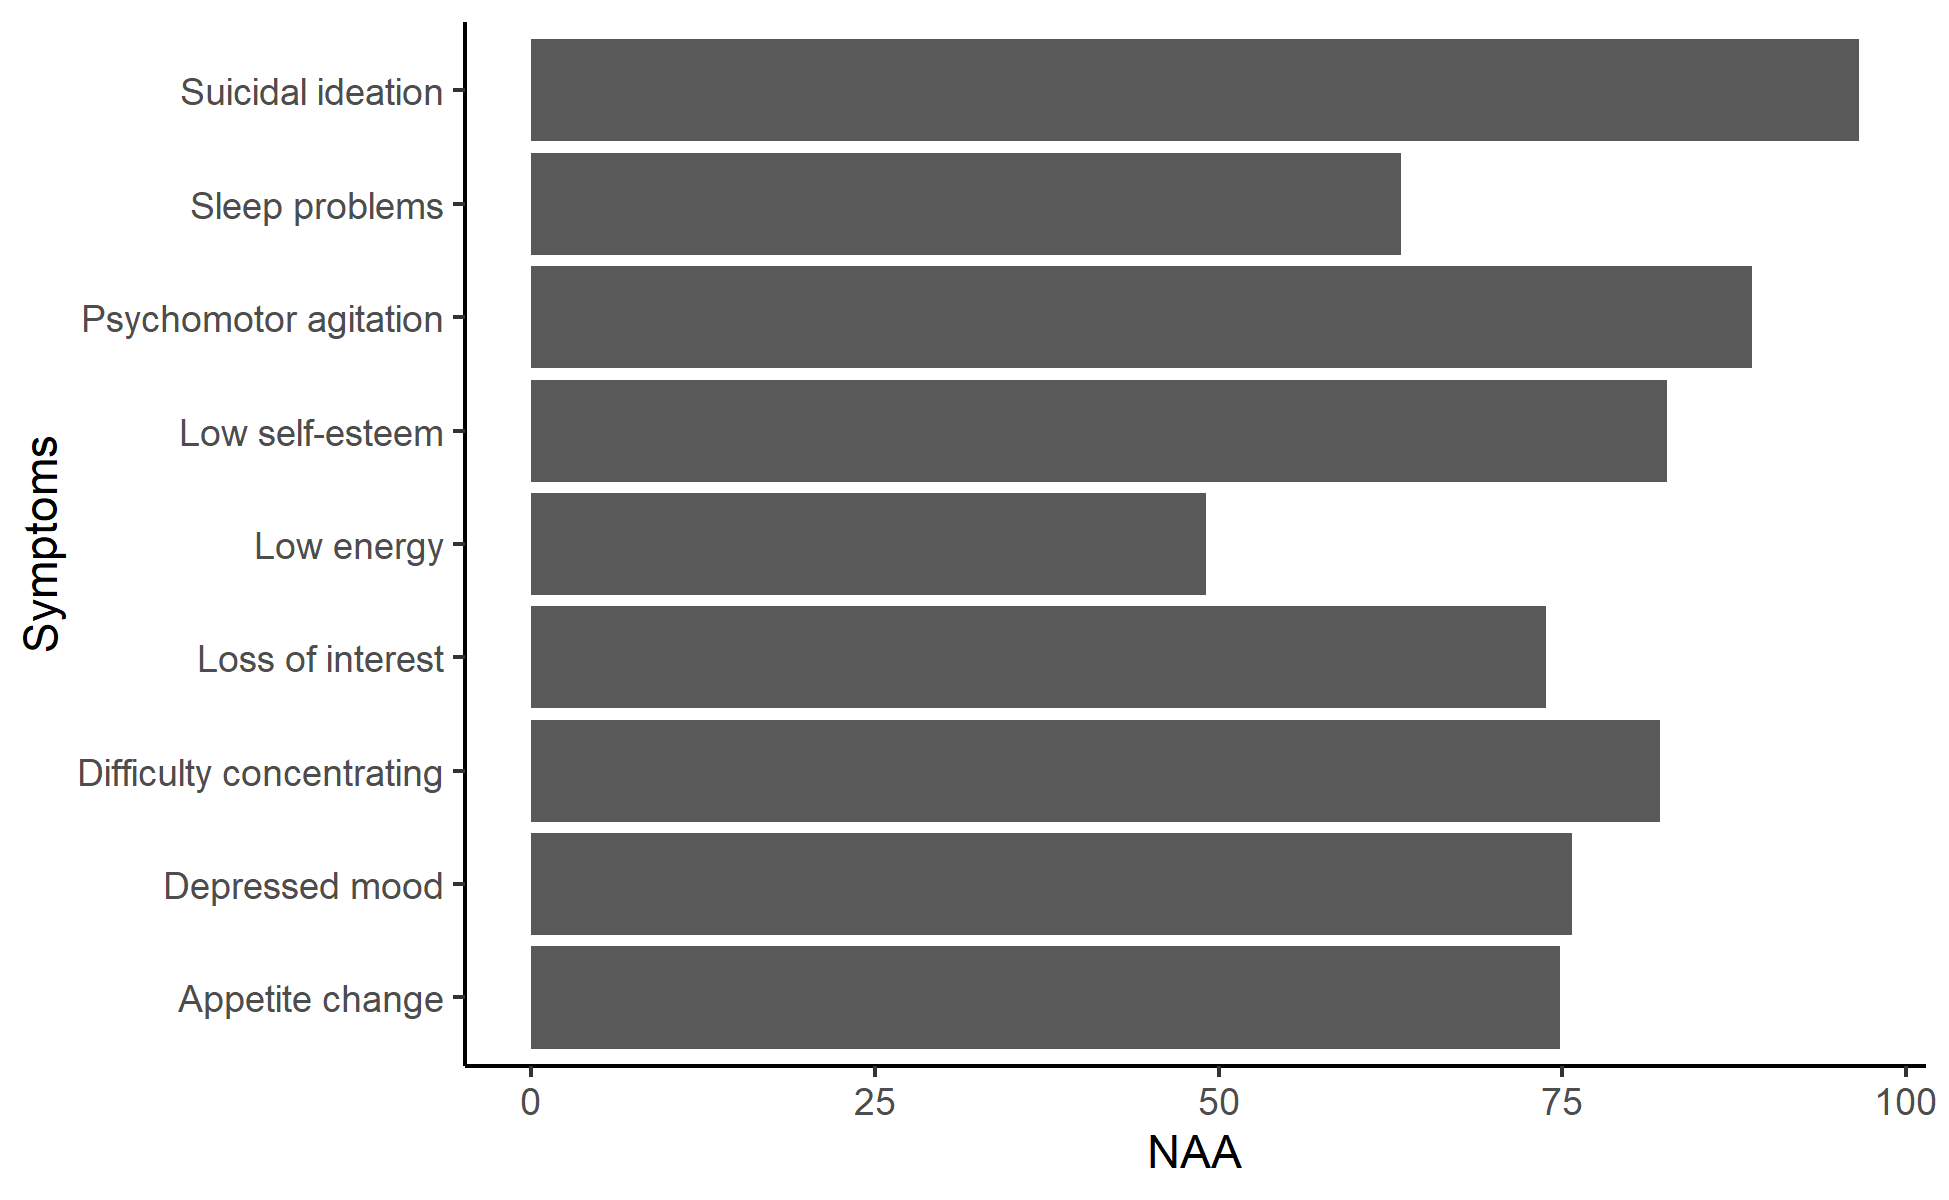
Interactive and static plots of depression symptoms.
Project Part 1
Prepparing the symoptoms of depression for plotting.
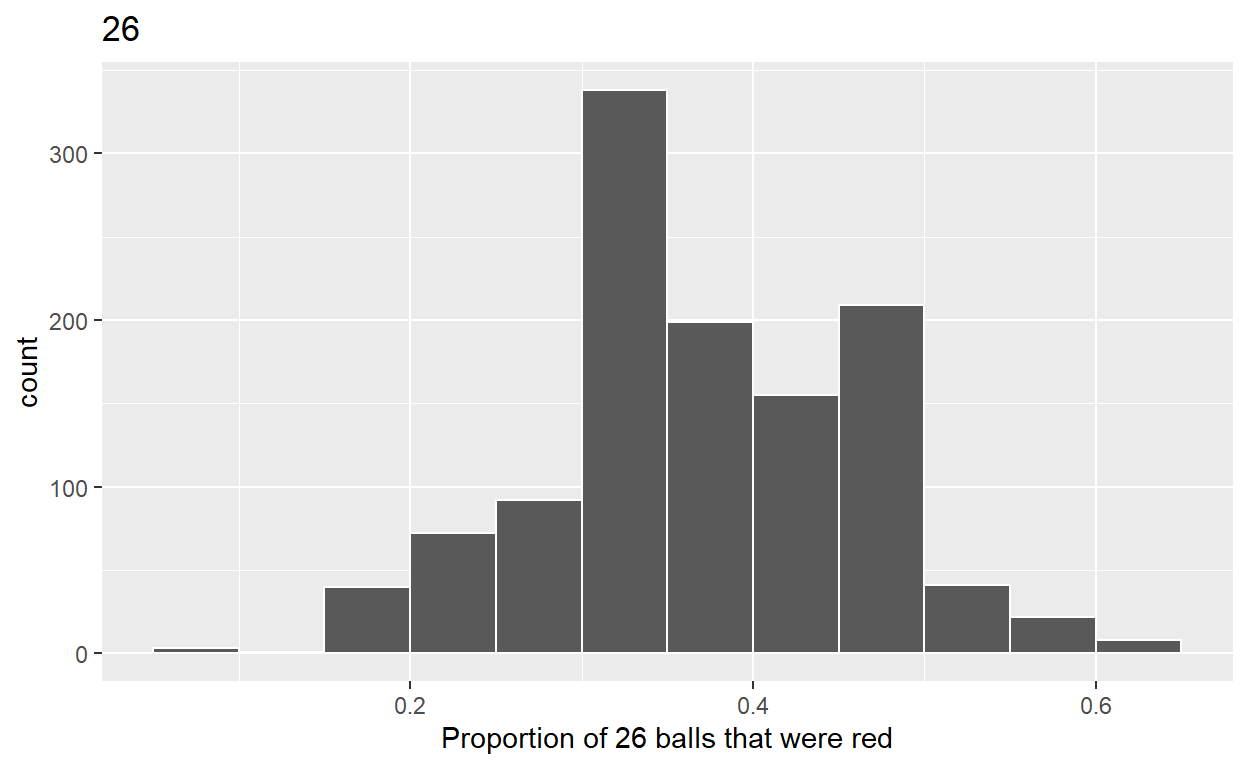
Sampling
Based on chapter 7 of ModernDrive. Code for Quiz 11. date: 2022-04-18
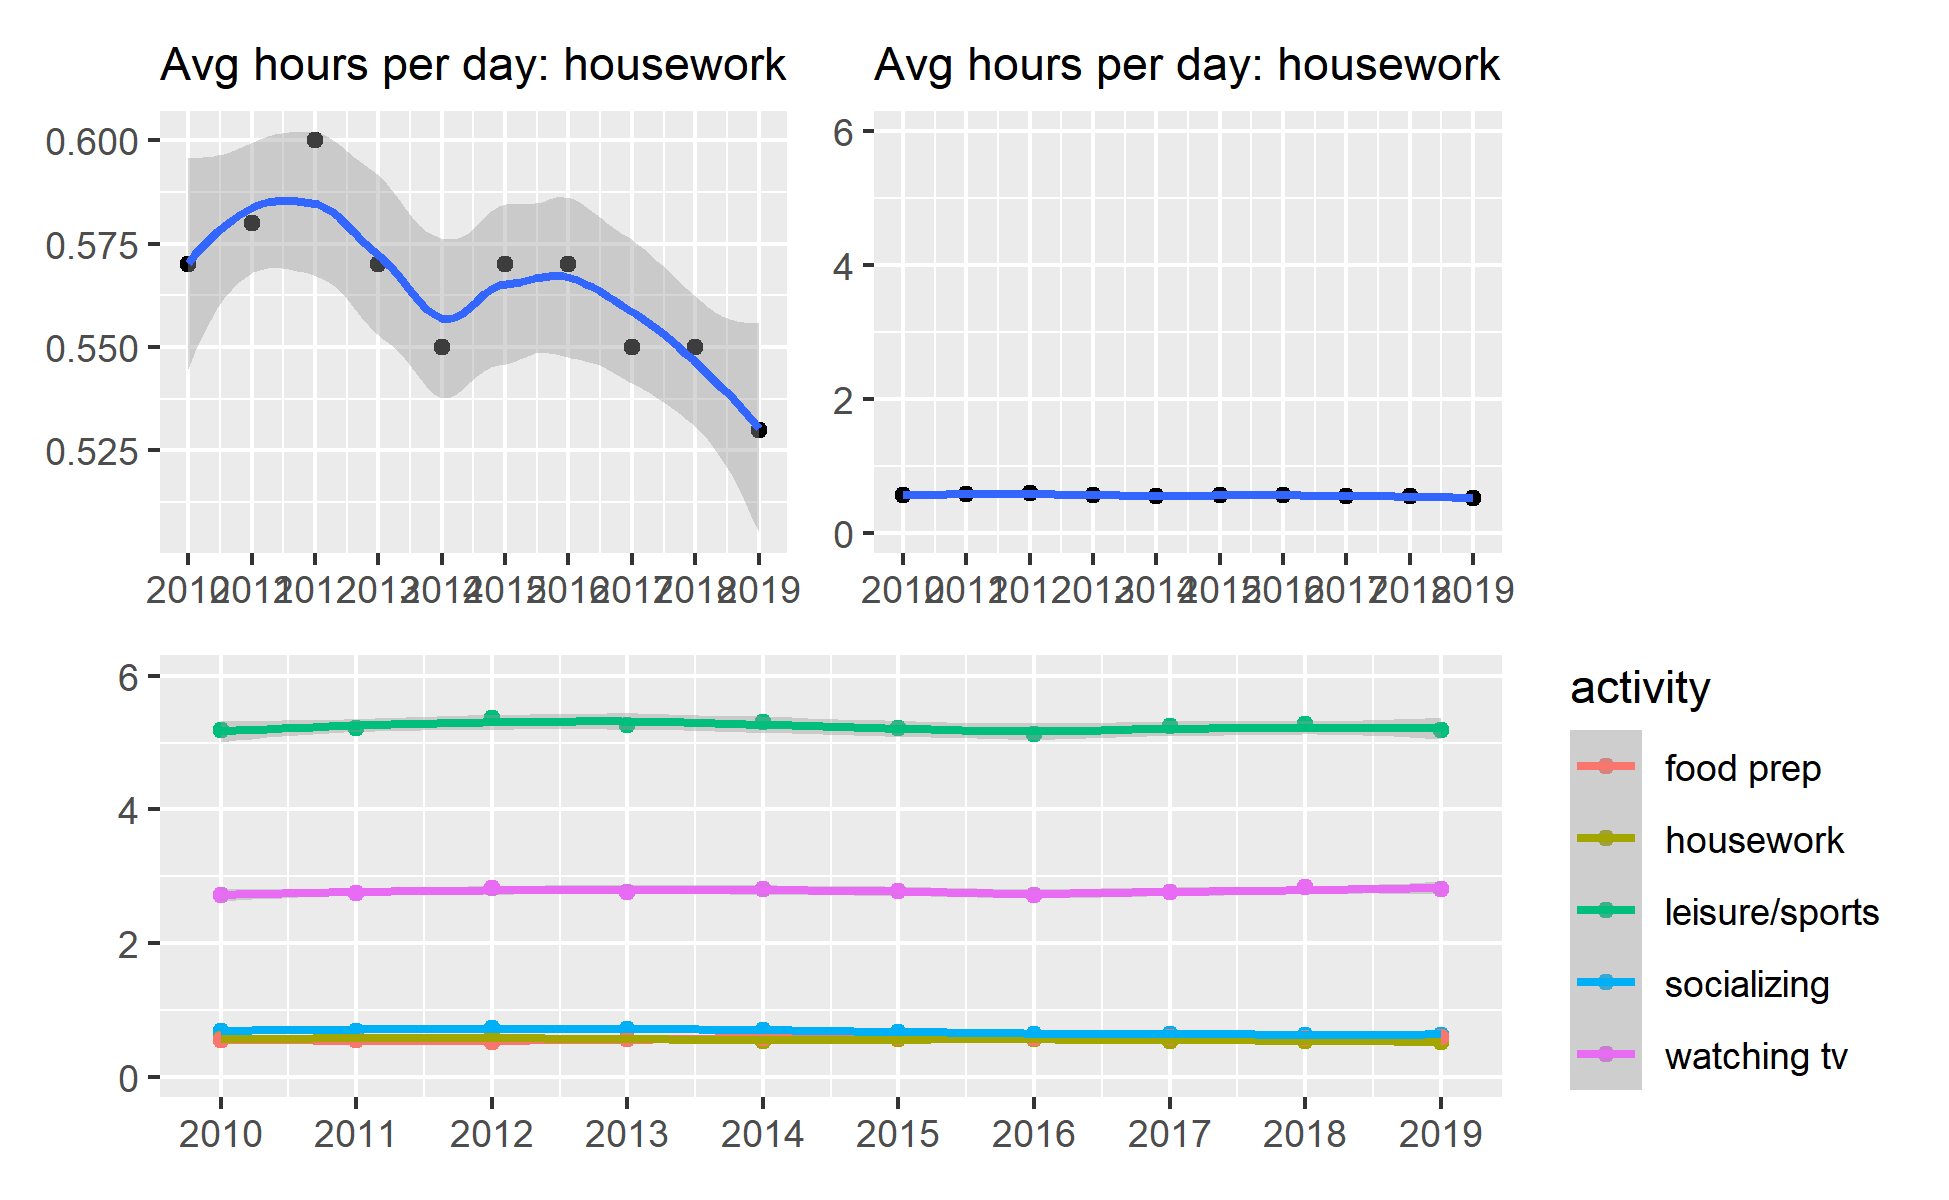
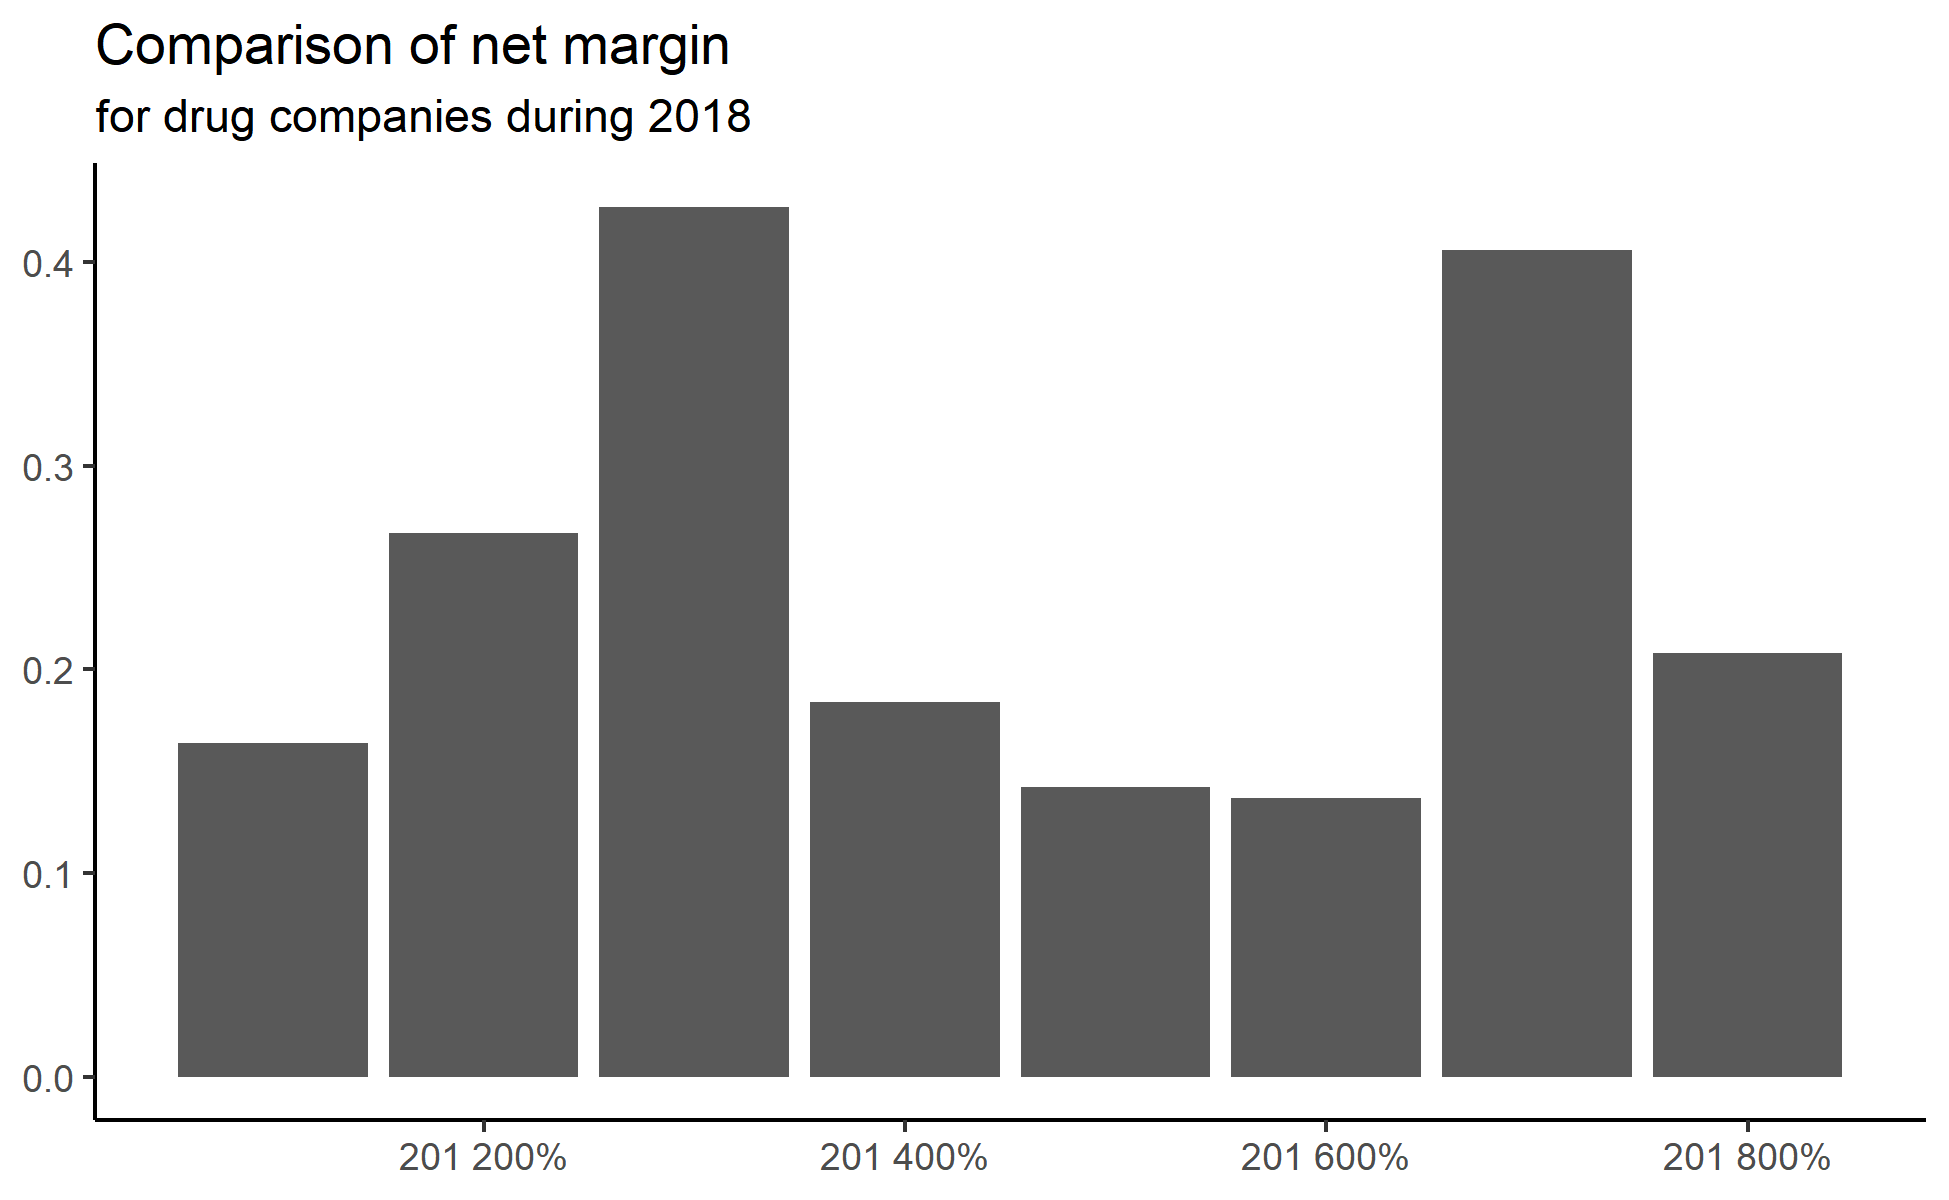
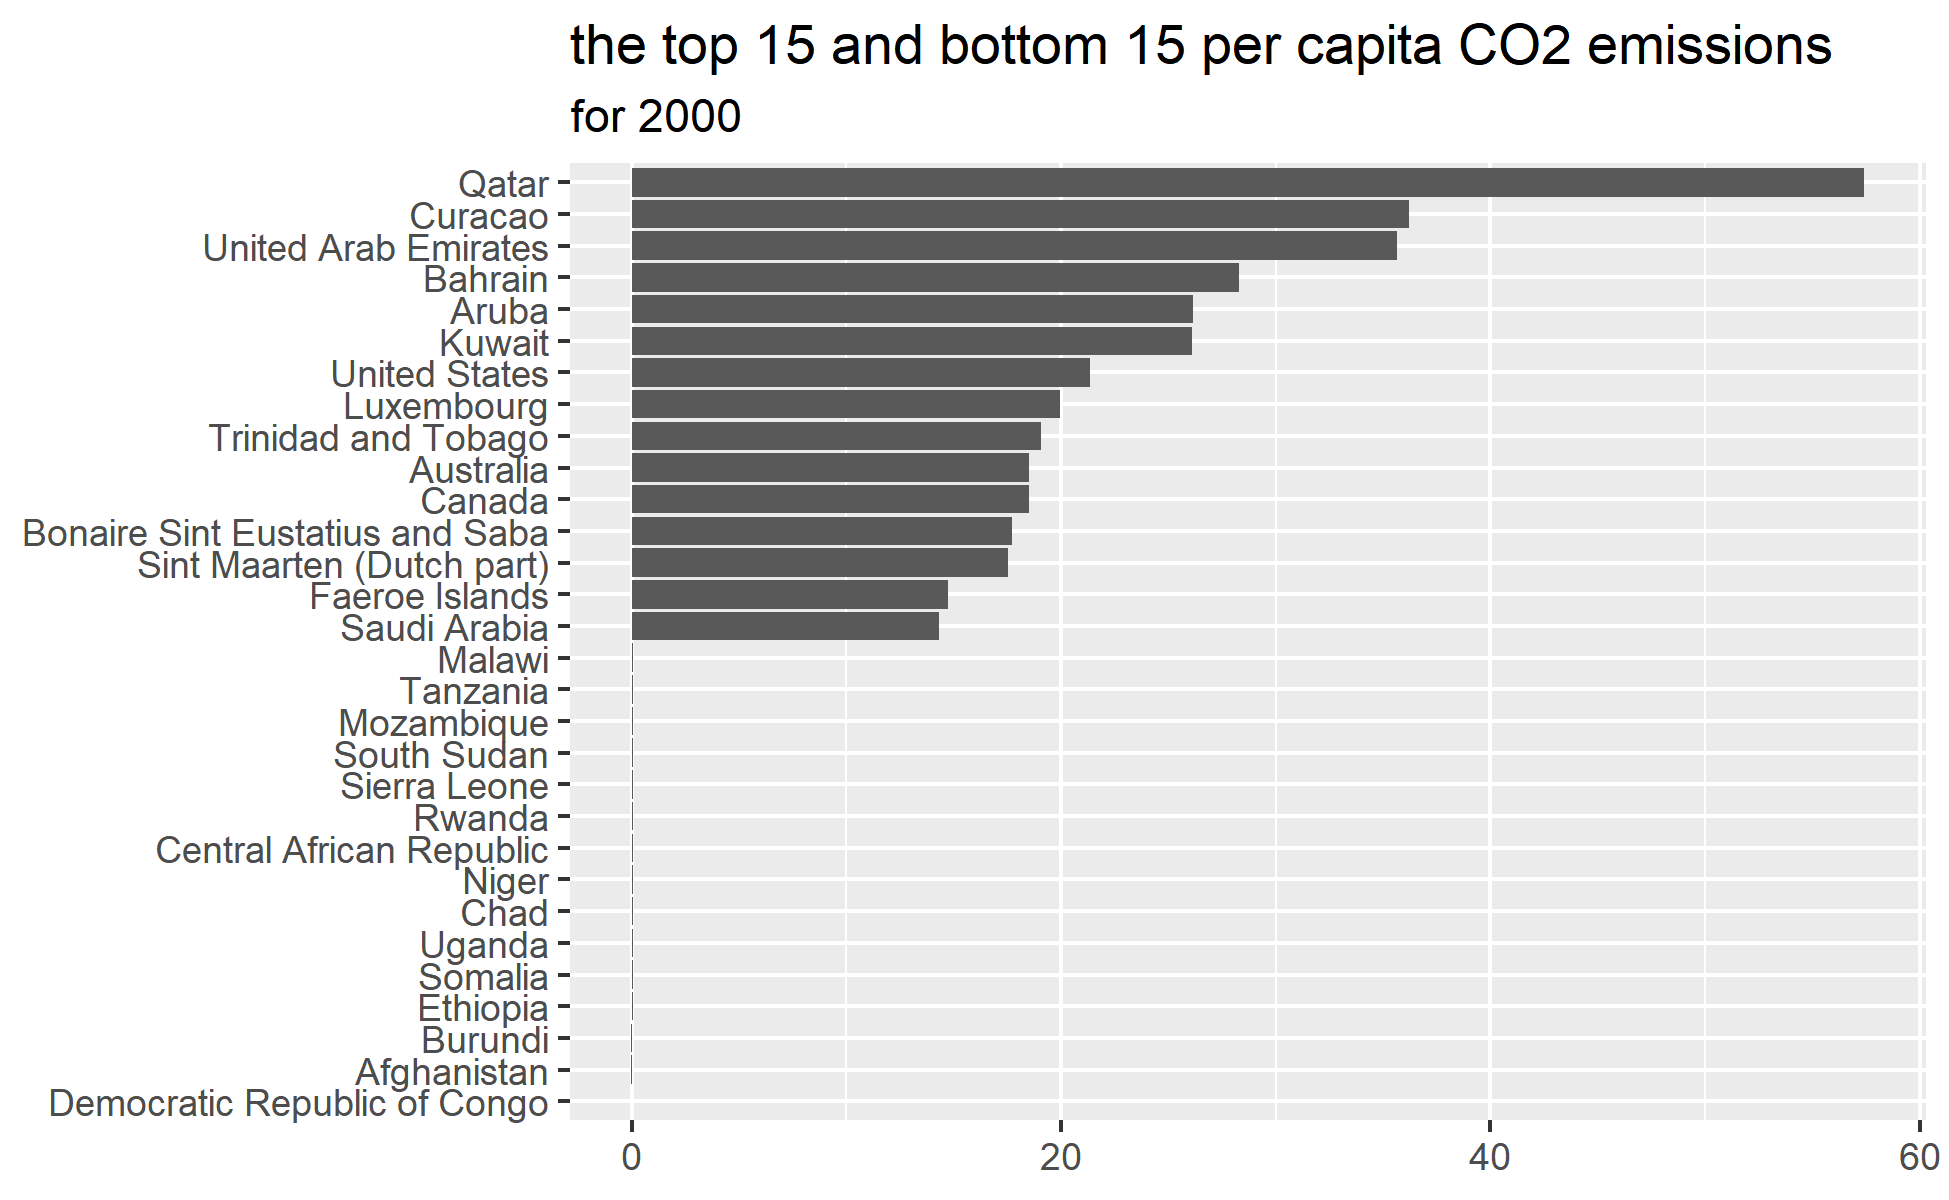
Exploratory analysis II
Data visualization, part 2. Code for Quiz 8.
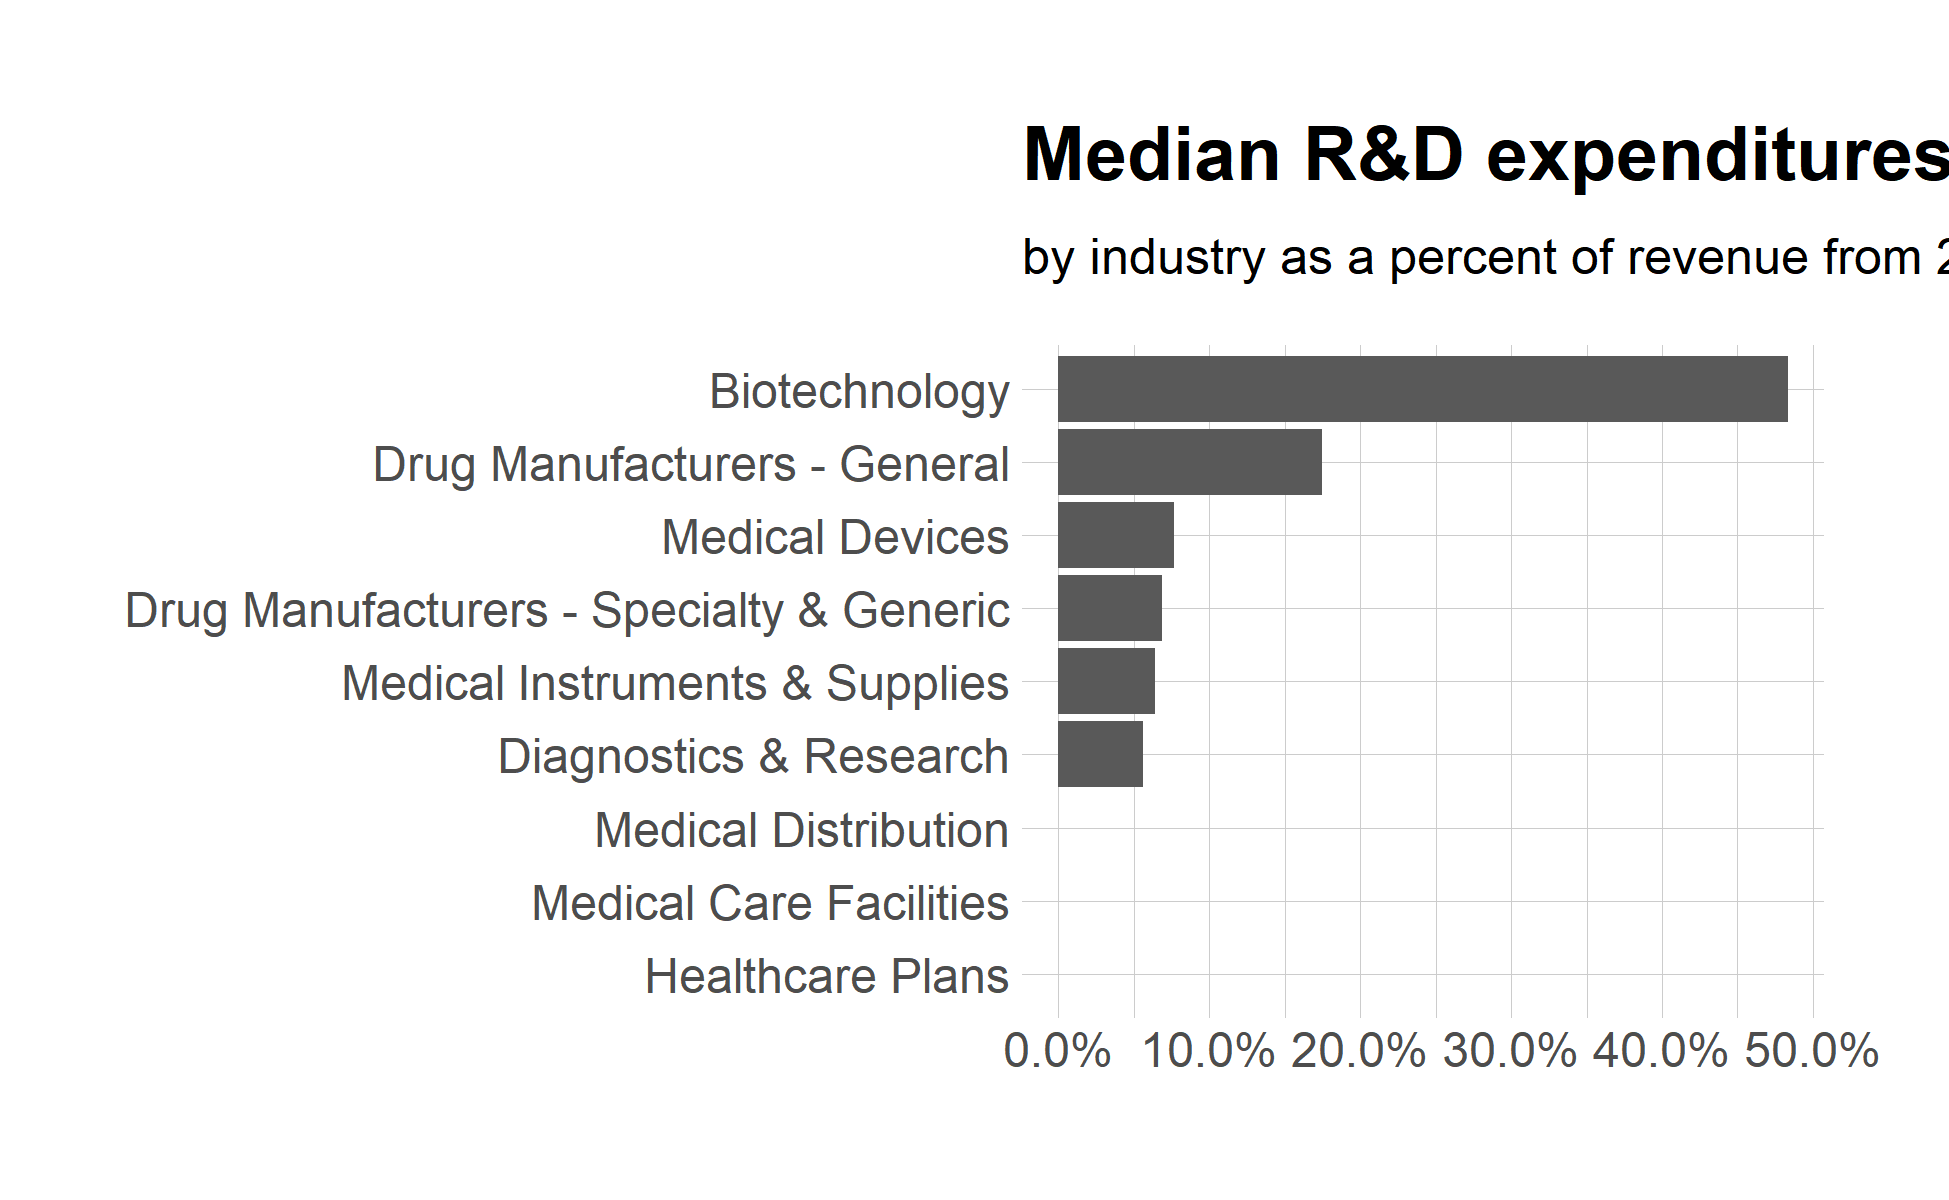
Joining data
Code for quiz 6, more dplyr and our first interactive chart using echarts4r.
Data Manipulation
Code for Quiz 5. More practice with dplyr functions.
Reading and writing data
Code and text for quiz 4.
Introduction to dplyr
Code and text for Quiz 3.
Summary statistics
Comparison of R and Excel